In 2007, OrangeHoops inducted its charter class into the OrangeHoops Hall of Fame: Dave Bing, Derrick Coleman, Sherman Douglas, Vic Hanson, and Pearl Washington. The next several years saw the addition of Billy Owens (2008), Billy Gabor (2009), Lawrence Moten (2010), Louis Orr (2011), Roosevelt Bouie (2011) John Wallace (2012), Rony Seikaly (2013), Vinnie Cohen (2014), Etan Thomas (2015), Joe Schwarzer (2016), Lew Andreas (2017), Carmelo Anthony (2018), Stephen Thompson (2019), Hakim Warrick (2020), Gerry McNamara (2021), and Rudy Hackett (2022). So the list now stands at 22. Another year has passed, and now it is time for the 2024 inductee.
I established my rules for the OrangeHoops Hall of Fame back in 2007 and you can catch up on them here. 2024 does have eight new eligible candidates (using the fifteen year rule): Eric Devendorf, Kevin Drew, Jonny Flynn, Paul Harris, Kristof Ongenaet, Jake Presutti, Justin Thomas, and Sean Williams.
Eric Devendorf was a fiery trash talking guard who could aggressively take the ball to the hoop or pull up for a three pointer. Devo was a four year starter who ended up with 1,680 career points.
Kevin Drew was a walk on guard his freshman year; he never played in a game. He was a star lacrosse player for four seasons earning Big East First Team honors his senior year.
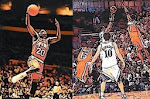
Jonny Flynn was a speedy point guard who led the Orange offense for two seasons. Flynn was a McDonalds High School All-American. He would play in the NBA for three seasons.
Paul Harris was an explosive muscular forward who was terrific on the offensive boards. He would play for the Orange for three seasons.
Kris Ongenaet was a defensive minded forward for the Orange for two seasons. He was a solid rebounder known for his hustling play, and was decent passing the ball.
Jake Presutti was a walk-on guard for four seasons. He would play 30 games and score 11 points.
Justin Thomas was a walk-on guard for three seasons. He would play 23 games and score 12 points. Thomas memorably played in the last overtime period of the six overtime win against UConn, as Syracuse had no scholarship players remaining due to fouls.
Sean Williams was a lanky 6'11" center who came to Syracuse as a "project". He played in 16 games in two seasons before transferring.
Flynn and Devendorf would both crack my list of top 10 candidates.
I think this year’s viable top 10 candidates come down to the following, listed chronologically: Lew Castle, Dennis DuVal, Jimmy Lee, Danny Schayes, Leo Rautins, Dave Johnson, Jason Hart, Preston Shumpert, Eric Devendorf, and Jonny Flynn.
Castle was a two time All-American at Syracuse, and was captain and leading scorer of Syracuse’s only undefeated team, the 1913-1914 squad that went 12-0.
DuVal was a flashy point guard for Syracuse in the early 70s. When he graduated from Syracuse he was only second to Dave Bing in career points scored. He was a three year started and averaged 18.6 ppg. DuVal was a third team All-American his senior year
Lee was a clutch shooter with terrific perimeter range, and outstanding free throw shooting ability. He was able to use his shooting ability to set himself up as a solid passer. Lee's 18 foot jumper with five seconds remaining led the Orangemen to beat heavily favored North Carolina, as the Orangemen eventually moved on to their first NCAA Final Four. Lee would end up making the All-Tournament team for his outstanding performances.
Schayes was a skilled center with a good shooting touch, and solid overall basketball skills. He unfortunately sat behind the legendary Roosevelt Bouie his first three seasons, but he led the Orange his senior year in scoring and rebounding, earning an All Big East First Team selection.
Rautins was a terrific ball-handling forward with a nice shooting touch, solid rebounding and scoring skills. He is most well-known for his game winning tip in basket to win the Big East Championship in triple overtime against Villanova in 1981. Rautins also recorded two triple-doubles in Big East action.
Johnson was a 6'5" swingman during the heights of Syracuse's program. He was a defensive replacement his freshman and sophomore year, and would development into one of the Orange's primary offensive threats his junior and senior year. Johnson would earn All Big East First Team his senior year.
Hart was a speedy defensive point guard, and a four year starter. He was a decent ball handler, and finished his career as the number two assist man all time at Syracuse. He was much better on the defensive end, and would finish as SU's all-time leader in steals. Hart would have a 9 year career in the NBA, mostly as a backup guard.
Shumpert was one of the best three point shooters in Syracuse history, with terrific range. He was a streaky shooter and carried the Orangemen to many victories, seven times in his career scoring 30+ points in a game. He would be named to the Big East First Team both his junior and senior seasons, averaging 20.7 points per game his senior year. He was not a strong defensive player, and there were questions about his temperament, particularly related to issues with DeShaun Williams. Shumpert is currently the 8th all time leading scorer at SU.
All are worthy players, and tough selections to make. I designed my selection rules to make it tough; the Hall of Fame should be the 'best of the best', and I would rather have a line of worthy players outside the Hall of Fame, than cheapen it by having lessor players included.
Ten very good candidates, and a couple of those players are among my all-time personal favorites. The 2024 inductee is Jonny Flynn.
Flynn was a speedy guard with a great ability to drive to the basket as well as pull up for a three pointer. He was a terrific passer and came to Syracuse heralded as a McDonald's All American.
Flynn would win the Big East Rookie of the Year his freshman season, and earned Big East 2nd Team honors his sophomore year.
He would score a career high 35 points in a loss to Providence. Flynn was pivotal in the memorable six overtime win against UConn with a game high 34 points. He played 67 of the game's 70 minutes, shot 16-16 from the free throw line, had 11 assists and 6 steals.
Flynn would finish his Syracuse career with 1,211 points on 16.6 ppg, along with 439 assists at 6.0 apg.
Flynn was the #6 overall pick in the 2009 NBA draft selected by the Minnesota Timberwolves. He averaged 13.5 ppg his rookie season before injuries sidelined him. He would play 3 seasons in the NBA before playing internationally in Australia and Italy.